Home › Continuous glucose monitoring › Reading your report
What is on the page
Almost every sensor report, whichever system produced it, contains the same four things:
- A statistics block: average glucose, time in each range, variability, and how many days of data it is based on.
- One composite day, usually called the ambulatory glucose profile. Every day of the wear period is stacked on top of each other into a single 24-hour picture, with shaded bands showing the range your readings fell in at each hour. This is the most useful panel and the one most people skip.
- The individual days, one small graph each.
- A number called GMI, which is not your HbA1c. More on that below.
Read them in the order below rather than the order they are printed. The printed order leads with the average, which is the least informative figure on the report.
The order to read it in
- Lows, first and always. Find time below 70 mg/dL, and separately below 54. This is the only part of the report that can harm you this week rather than in ten years. If there is a cluster of lows at the same hour on several days, that hour is the finding, not the average, not the peaks.
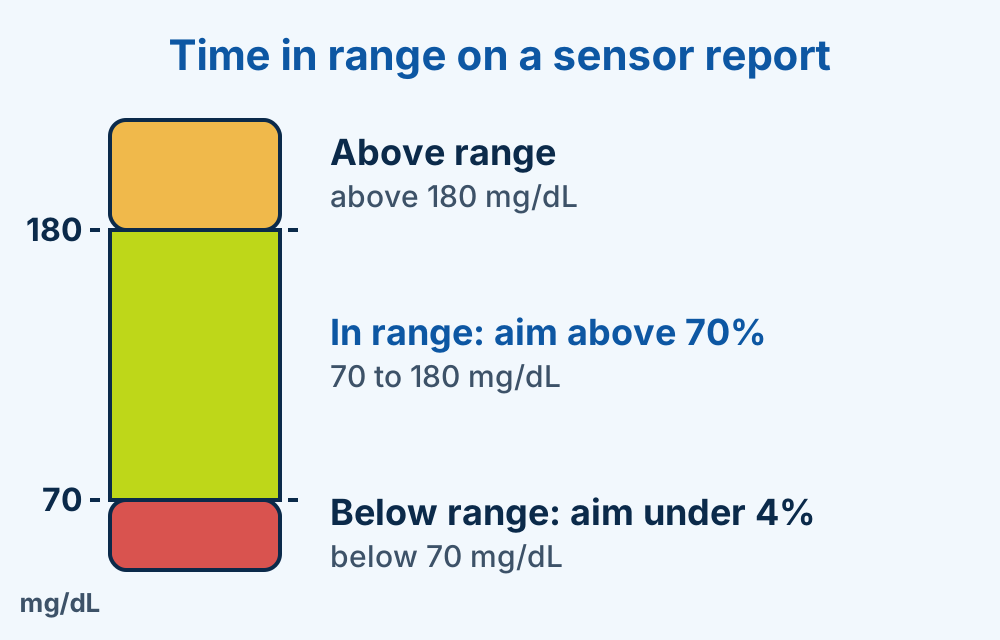
- Time in range. The share of the fortnight spent between 70 and 180 mg/dL. One number, easy to follow month to month, and the one worth writing down.
- The overnight shape, on the composite day. Look at midnight to waking. Flat, drifting up, or dipping then climbing? A high morning reading is a consequence, and this is where its cause lives.
- The meal peaks. Look at the three bumps and ask how high, how soon, and how long until it came back. A peak that returns to baseline in two hours is a different problem from one still elevated at four. See what food does to the line.
- Variability, last. How wide the shaded band is. A wide band means your days do not resemble each other, which usually points at timing, shift work or missed doses rather than at food choice.
The numbers, and what counts as good
| Metric | What it is | General target |
|---|---|---|
| Time in range | 70–180 mg/dL | Above 70% about 17 hours a day |
| Time below 70 | Low | Under 4% about 1 hour a day |
| Time below 54 | Serious low | Under 1% about 15 minutes |
| Time above 180 | High | Under 25% |
| Time above 250 | Very high | Under 5% |
| Variability (CV) | How much the line swings | Under 36% |
| Days of data | How much of the wear period was actually captured | 14 days, 70%+ |
These are general figures, not yours. They are the international consensus targets for most non-pregnant adults with diabetes. In pregnancy the range is tighter and starts lower. If you are elderly or frail, or you have stopped feeling your lows, the safer target is a looser one: avoiding lows matters more than reaching a percentage. Which set applies to you is a conversation, not a chart.
The two numbers people misread
GMI is not your HbA1c
GMI, sometimes printed as "estimated A1c", is a calculation from your sensor average over about two weeks. HbA1c is a laboratory measurement reflecting roughly three months. They are answering different questions over different periods, and a gap of half a percentage point in either direction is common and does not mean either is wrong. Do not go looking for an error when they disagree, and do not report GMI to anyone as your HbA1c.
Data capture decides whether the report means anything
If the sensor was off your arm, out of range of your phone, or unscanned for long stretches, the percentages are calculated on what is left. A report covering 45% of the fortnight, with the gaps mostly overnight, will show excellent numbers and hide the entire problem. Check this figure before you believe any of the others.
Five patterns that cover most first reports
The line climbs before you wake
A rise in the early hours, before eating anything. This is normal hormonal physiology exaggerated by diabetes, and it is a treatment question, not a food question.
Dinner is still on the line at midnight
Usually a late or large evening meal, and often the easiest thing on the whole report to change. Same food, ninety minutes earlier.
A dip at the same time every afternoon
Often a dose acting after a small lunch. People describe it as tiredness at five o'clock and rarely recognise it as a low until they see it drawn.
Flat, but flat too high
Little variability and a good-looking average with the whole line sitting above range. Nothing dramatic to point at, which is why it gets missed, and it is straightforwardly treatable.
Two weeks that look like two different people
Wildly different days. Look at what was different about the days, not the food: shift work, travel, fasting, a missed dose, illness. The pattern is in the calendar.
What we do with it
Bring the report, or share it from the app, along with your current medicines and a note of what you ate and when. Consultation ₹500, which includes going through it line by line and a diet consultation with our dietitian at no separate charge. We do not charge separately for reading a report: a sensor nobody explains was not worth wearing.
Sensor prices depend on brand, wear period and stock: Caspian Pharmacy, +91 85198 41154. Appointments: reception, +91 89193 41154. Mon–Wed, 9 am–1 pm and 3–9 pm; Thu–Sat, 3–9 pm; Sun closed.
Do not change an insulin dose because of something you read on this page. Sensor data changes doses safely only alongside someone who can see the whole picture. If you are having a severe low (confused, unable to swallow safely, fitting or unconscious), call 108 or go to the nearest hospital with emergency facilities. There is no emergency department here.
Medically reviewed by Dr. Khizer Hussain Junaidy, Diabetologist & Bariatric Physician, Telangana State Medical Council 04937. General information for patients of Caspian Healthcare: your own doctor's advice comes first.